Cryptocurrency Weekly Summary
- Cryptocurrency weekly performance was solid, after a slow start, as softer U.S. dollar joined positive industry news.
- With Bitcoin trailing altcoins, and on-chain signals are dicey, market risks are back in focus.
- Crypto bulls cheered Trump’s 401(K) move, an end of U.S. SEC vs. Ripple legal battle and Ethereum’s institutional buying.
- Fed concerns and Trump’s political and tariff moves weighed on U.S. Dollar before this week’s CPI and Retail Sales reports.
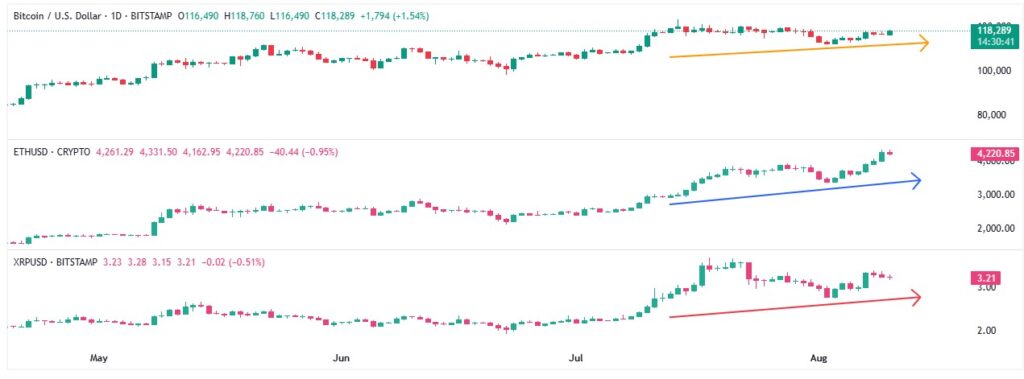
Cryptocurrency markets experienced a positive weekly performance, despite a slower start, as the softer U.S. dollar combined with pro-industry news and institutional buying. Even so, Bitcoin’s (BTC) failure to mirror the rally in Ethereum (ETH), Ripple (XRP), and other altcoins raises suspicions among the traders.
Bitcoin (BTC) rose more than 3.0% last week, its biggest weekly gain in four, as bulls keep the reins above $118K by the press time of Sunday.
More importantly, Ethereum (ETH) jumped 20% during the week, despite retreating from its highest level since December 2021 to $4,165 at the latest.
Meanwhile, Ripple (XRP) snapped its two-week downtrend with over 8.00% weekly gain, even as it drops for three straight days to Sunday, near $3.16 as we write.
The Weekly Moves
Key Macro Catalysts
The first full week of August carried few economic data/events that could grab the market’s attention. However, chatter surrounding the Federal Reserve (Fed) and U.S. President Donald Trump’s trade and political moves entertained market participants, mostly weighing on the U.S. Dollar and allowing cryptocurrencies to remain firmer.
Among the key catalysts, a shift in the Fed officials’ tone towards more dovish actions, with some confirming a September Fed rate cut and two more during 2025, gained major attention and weakened the U.S. Dollar Index (DXY). Even so, Trump-linked challenges to the sentiment put a floor under the DXY, allowing it to post a 0.40% weekly loss to 98.26 at the latest.
Disappointing U.S. employment data, coupled with weak activity reports—especially the ISM Services PMI and S&P Global PMIs for July—raised doubts about easing inflation and worsening job conditions. This increased pressure on policymakers to consider rate cuts. Several Federal Reserve officials have now expressed support for cutting rates, signaling a shift away from Chair Powell’s strict data-dependent stance and seemingly conceding to Trump’s calls for rate cuts.
Elsewhere, U.S. President Donald Trump rattled global markets with new tariff actions and political moves. He pushed Russia toward a peace deal with Ukraine but distanced himself from Israel’s plan to take full control of Gaza.
Trump also continued criticizing North Korea and Iran’s nuclear ambitions while indirectly warning Russia by imposing steep tariffs on its oil buyers, mainly India, and voicing his views on Truth Social.
The Wall Street Journal (WSJ) reported that Russian President Vladimir Putin told U.S. envoy Witkoff he would agree to a ceasefire if Ukraine withdrew forces from all of eastern Donetsk.
Concerns over a U.S. recession, progress on the EU-U.S. trade deal, and the White House’s decision to extend a pause on China tariffs were other major factors influencing markets last week.
Crypto Market News
In the cryptocurrency universe, U.S. President Donald Trump’s signing of an executive order to allow private equity, real estate, cryptocurrencies, and other alternative assets in 401(K)s, opening the doors to roughly $12.5 trillion in retirement accounts, gained major attention. This isn’t ordinary news. Trump justified his pro-crypto status with this real action and allowed crypto bulls to think about long-term investments.
Also read: Crypto in 401K Plans, Trump Ends Operation Checkpoint 2.0, BTC Futures Open Interest Surge
Elsewhere, the U.S. Securities and Exchange Commission (SEC) announced that liquid staking and related tokens are not considered securities, offering relief to Decentralized Finance (DeFi) participants and boosting hopes for more crypto-friendly moves, especially when backed by the Trump administration.
Further, the U.S. Securities and Exchange Commission (SEC) voted to drop its appeal against the Programmatic Sales ruling, leading to a Joint Stipulation of Dismissal with Ripple Labs Inc. — officially ending nearly a five-year legal battle between the U.S. SEC & Ripple.
Elsewhere, pro-Bitcoin economist Stephen Miran was appointed as the current chair of the Council of Economic Advisors. Miran is known for his support of lower interest rates and pro-Bitcoin status. Hence, his appointment joins figures like Gary Gensler to keep BTC bulls hopeful.
Meanwhile, the U.S. Department of the Treasury’s Financial Crimes Enforcement Network (FinCEN) warned of a spike in Bitcoin ATM scams, with losses jumping 31% to $246.7 million in 2024, alongside a 99% rise in complaints.
Having discussed the overall market performance and major crypto drivers, let’s focus on the individual cryptocurrencies.
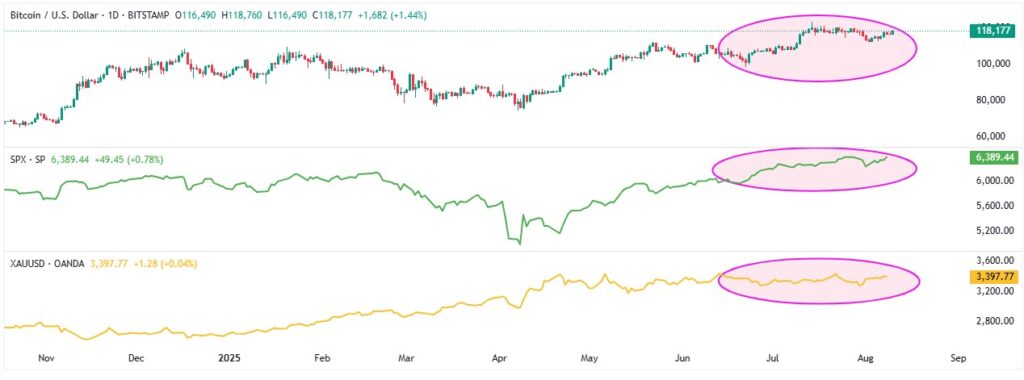
Bitcoin Follows Equities, Gold
Bitcoin (BTC) price dropped for three out of seven days in the last week as market sentiment dwindled amid the trade/political pressure and pushed traders off the riskier assets in the beginning. However, Trump’s 401(K) announcement and a return of the U.S. spot Exchange Traded Fund (ETF) inflows convinced the BTC buyers.
Starting with the correlation chart from TradingView, Bitcoin (BTC) tracked the S&P 500 and the spot Gold (XAU/USD) closely last week.
The S&P 500 gradually rose during the week, dropping two days out of five, as it approaches the record high while posting over 2.0% weekly gains to 6,389 at the latest.
Gold (XAU/USD) appeared somewhat dicey but ended the week on the positive side. That said, the bullion posted weekly gains, finishing around $3,397, thanks largely to its jumps on Thursday and Friday, fueled by the market’s indecision and softer U.S. Dollar.
BTC, S&P 500 and Gold
ETF Signals, On-Chain Developments
Starting with the latest U.S. spot Exchange Traded Fund (ETF) data from the SoSoValue, the Bitcoin (BTC) spot ETFs recorded a two-day outflow pattern on Monday and Tuesday, but ended the week by paring the previous weekly outflow with a net inflow. That said, the weekly total net inflow was $246.75 million, versus last week’s -$643.04 million.
With this, the monthly BTC ETF figures for August snap the four-month uptrend with $565.49 million, versus July’s $6.02 billion in inflows.
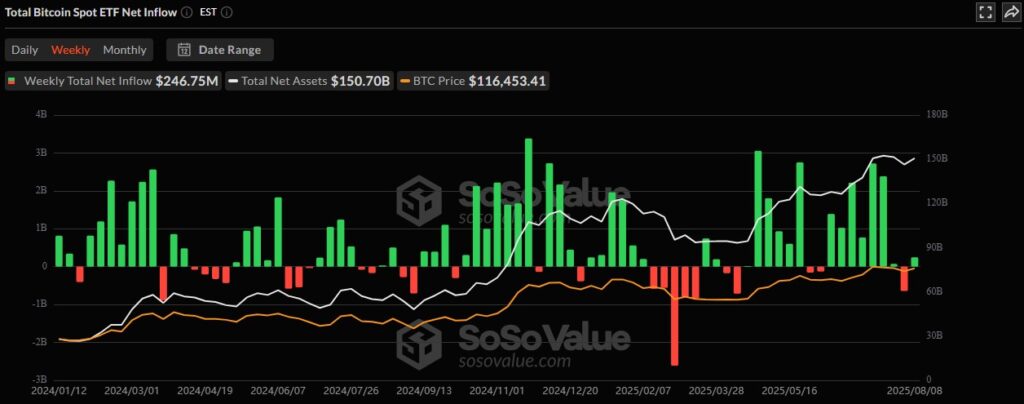
With this magnitude of surprise from the ETF flows, a pullback in the BTC/USD prices was justifiable. However, this doesn’t signal the start of a bearish BTC/USD trend unless the outflows continue in the coming sessions.
Bitcoin Whales Turned Cautious, MVRV Ratio Tests Bulls
Bitcoin’s supply distribution data from Santiment shows conflicting signals, stirring debate among traders.
Bitcoin Supply Distribution for August 03-10
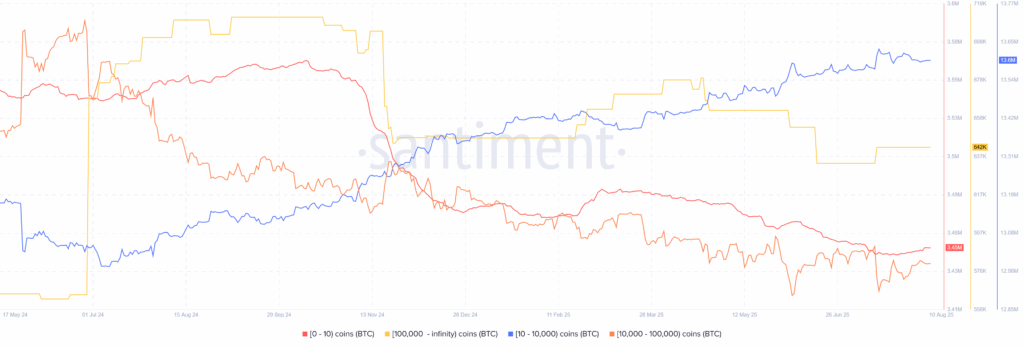
As per the Santiment data for August 03-10, the wallets (addresses) holding 10–10,000 BTC, known as sharks, reduced their holdings by 1,304 BTC, marking a 0.01% fall.
On the other hand, the retail wallets (holding 0–10 BTC) added 1,987 BTC (or +0.06% build), while the whales (wallets with 10,000–100,000 BTC) increased their holdings by 2,095 BTC, or +0.1%.
Meanwhile, the mega-wallets, wallets with over 100,000 BTC holdings, showed a meagre addition of 0.000152 BTC.
Hence, the sharks are trimming their positions, but the whales and the retail investors are quietly accumulating, which in turn suggests a possible sign of long-term confidence despite the short-term uncertainty.
MVRV Data Flashes Warnings
Elsewhere, Bitcoin’s 4.0% increase last week came with a clear warning that the market was overheating, at least per the Santiment data. The MVRV (Market Value to Realized Value) ratio, which compares the current price to the average cost basis of holders, remains near the risky levels.
Bitcoin (BTC) MVRV Data
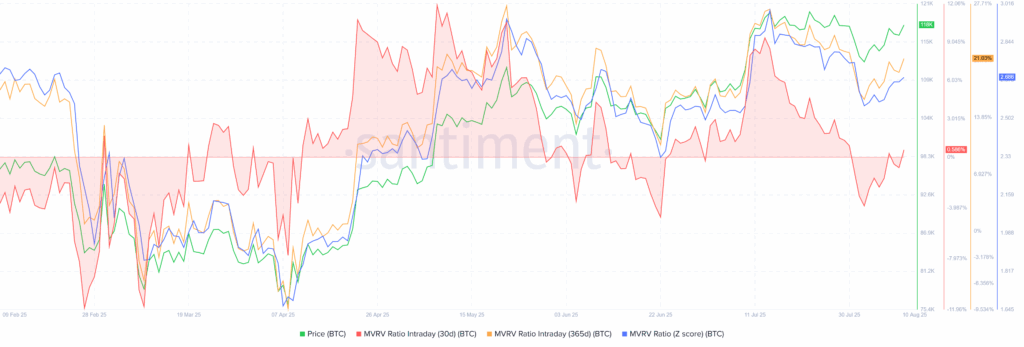
The BTC’s 365-day MVRV surged above 20%, showing long-term holders are deep in profit. Such elevated MVRV levels often signal that many investors may start taking profits, increasing the risk of a pullback in prices.
It should be noted that the 30-day MVRV recovered from the negative region, up 0.66%, and suggests a potential BTC strength for the short term.
That said, the recent run-up in the 30-day MVRV ratio and the BTC price suggests a potential short-term strength should the fundamentals support. However, the risks of witnessing a correction in the long term can’t be ignored.
Technical Analysis Lures BTC Bulls
Despite a five-month-old “Rising Wedge” bearish chart formation, the BTC’s sustained trading beyond the key Simple Moving Averages (SMA) pushes back the bearish bias. Additionally, upbeat conditions of a 14-day Relative Strength Index (RSI) and bullish signals from the Moving Average Convergence Divergence (MACD) to lure Bitcoin.
Bitcoin Price: Daily Chart Suggests Further Upside
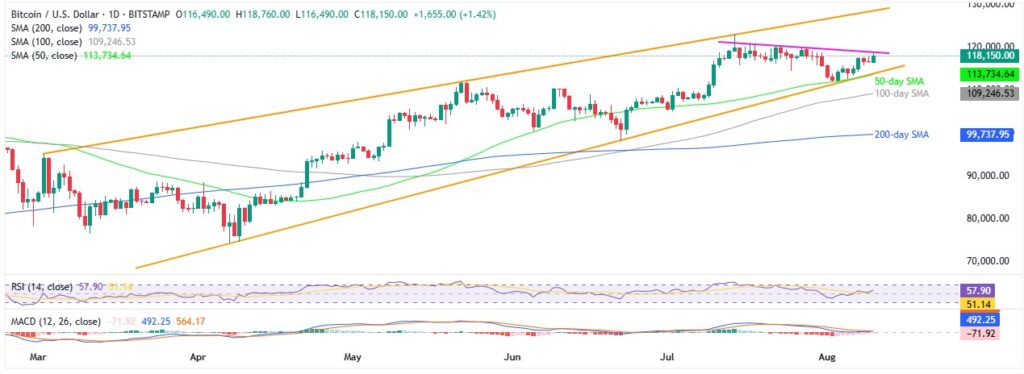
Bitcoin’s latest rebound from the 50-day SMA and an upward-sloping trend line from April joins a rising RSI and a potential bullish crossover on the MACD to defend bullish bias about the crypto leader.
However, a clear upside break of a three-week resistance line, close to $119K by the press time, becomes necessary for the buyers. Following that, the Bitcoin price could aim for the all-time high marked in July, around $123,230, before an upward-sloping resistance line from early March, near $129K by the press time.
Alternatively, a clear downside break of the $113,700 support confluence, encompassing the 50-day SMA and an ascending trend line from early April, becomes necessary to challenge the upside bias.
Following that, the 100-day and 200-day SMAs, respectively near $109,200 and $99,700, could challenge the south-run before rejecting the overall bullish trend.
Ethereum Buyers Are Hopeful
Ethereum rocked the boat with its 20% weekly gains, surpassing Bitcoin (BTC) and Ripple (XRP), as traders cheered institutional demand.
Santiment’s Maksim cites a massive purchase of 1.8 million ETH and a new $5 billion treasury fund filing to signal that big money is flowing into the preferred ecosystem.
ETH ETFs Attract Inflows
As per the latest SoSoValue data, Ethereum (ETH) spot ETFs rose during the last four consecutive days after witnessing a two-day outflow pattern, their first in weeks. With this, the weekly and monthly figures keep the ETH buyers hopeful.
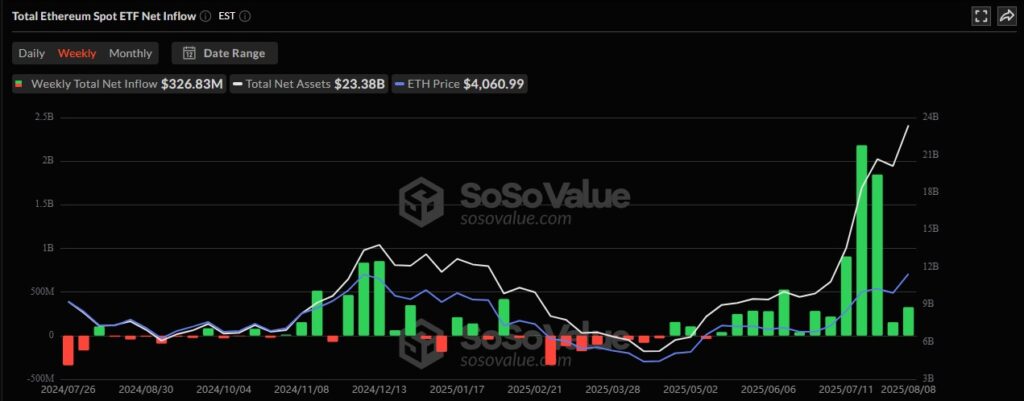
On August 8, the U.S. Spot ETH ETFs reported the highest inflow in over two weeks, with the daily figures of $461.21 million.
That said, the weekly ETH ETF flows remained positive for the 13th consecutive week, totalling $328.83 million. Meanwhile, July saw a record-breaking $5.43 billion in the U.S. spot ETH ETF inflows, extending its four-month uptrend, whereas August saw $174.57 million of total inflows.
Whale Buying Pattern
Ethereum’s supply distribution data from Santiment shows a clear divergence between the retail and institutional buyers.
Ethereum Supply Distribution for August 03-10
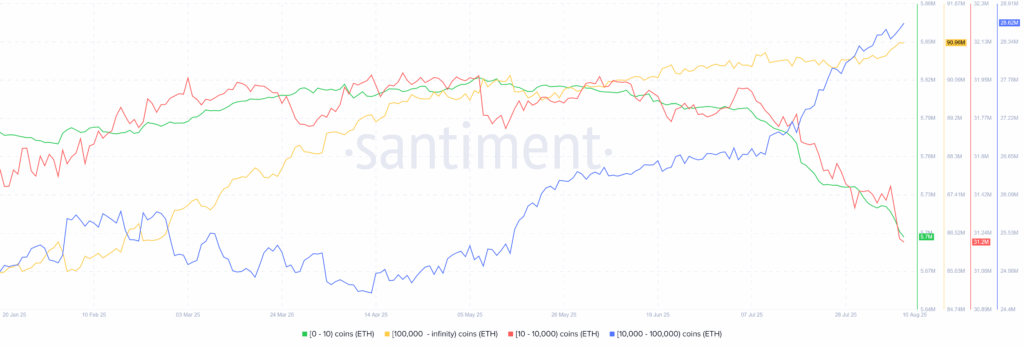
As per the Santiment data for August 03-10, the wallets (addresses) holding 10–10,000 ETH, known as sharks, reduced their holdings by 211,900 ETH, marking a 0.67% fall.
On the same line, the retail wallets (holding 0–10 ETH) reduced their holdings by 23,820.60 ETH (or -0.42%).
Alternatively, the whales (wallets with 10,000–100,000 ETH) increased their holdings by 285,410 ETH, or +1.01%.
Further, the mega whales, wallets with over 100,000 ETH holdings, also showed an addition of 318,60 ETH, or 0.35%, during the said period.
Hence, the sharks and retail traders are trimming their positions, but the big investors are accumulating the ETH, actually more aggressively, which in turn suggests a possible sign of long-term confidence in Ethereum.
ETH/BTC Chart Favors Ethereum Bulls
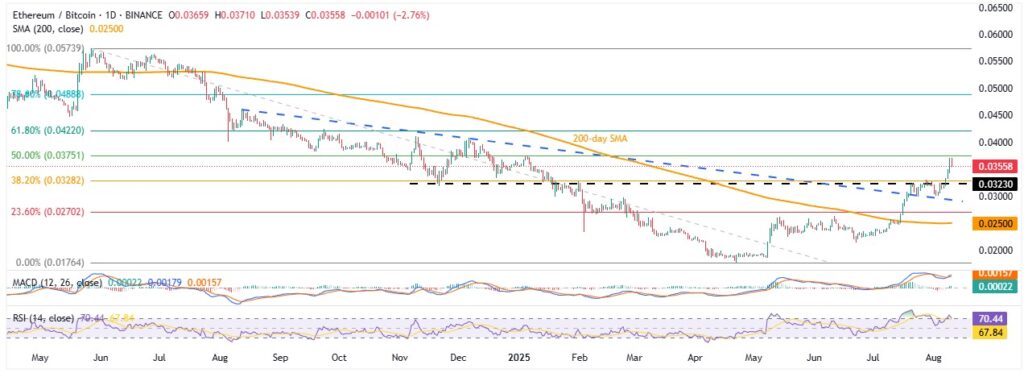
The ETH/BTC retreated from an eight-month high on Sunday, snapping its four-day winning streak, especially amid overbought RSI conditions. However, a sustained break above the 200-day Simple Moving Average (SMA) and key resistance lines from August and November 2024 defend ETH bulls.
That said, the ETH/BTC ratio eases beneath the 50% Fibonacci Retracement of its May 2024 to April 2025 downturn, close to 0.03751.
Even if the RSI turned overbought and triggered the quote’s latest pullback, the momentum indicator then retreated to near 70.00 and joins the bullish MACD signals, coupled with the aforementioned resistance breakouts, to suggest the ETH/BTC pair’s further advances.
This highlights the 50% and 61.8% Fibonacci ratios, respectively, near 0.03751 and 0.04220, for buyers before the mid-August 2024 peak surrounding $0.4590.
Meanwhile, the ETH/BTC pair’s pullback needs a sustained downside break of the previous resistance lines from November and August 2024, respectively, near 0.03250 and 0.02945, to convince the sellers.
Overall, the ETH/BTC ratio suggests further upside and a stronger Ethereum price compared to Bitcoin.
Ethereum Technical Analysis Pokes Bulls
Even if the institutional demand and the ETH/BTC ratio favor the Ethereum buyers, the daily chart of the ETH suggests a pullback in the prices.
Ethereum Price: Daily Chart Signals Pullback
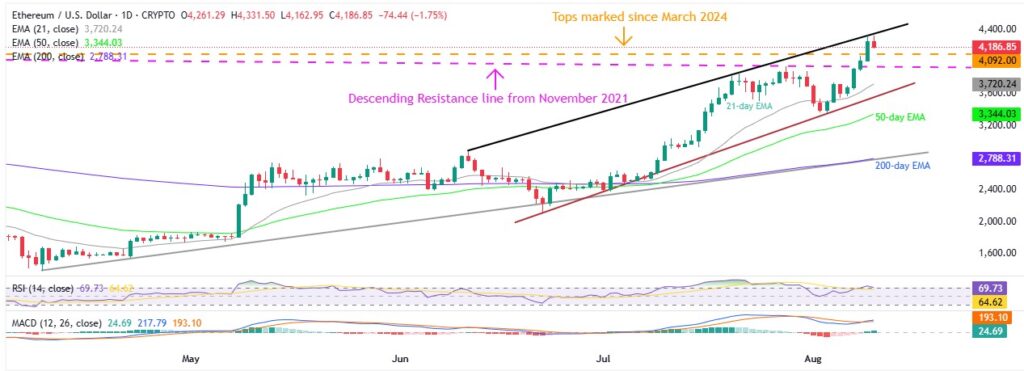
A clear upside break of a descending trend line from November 2021 and a horizontal area comprising multiple tops marked since March 2024 join bullish MACD signals to keep the Ethereum buyers hopeful.
It’s worth noting, however, that the overbought RSI triggered the ETH’s latest retreat from the upper boundary of a two-month bullish channel, currently around $4,350.
This suggests a pullback toward the $4,100 support zone comprising tops marked since March 2024, a break of which could direct the ETH bears toward the previous resistance line from November 2021, close to $3,930 at the latest. However, any further downside becomes meaningless beyond the stated channel’s lower boundary surrounding $3,550.
Alternatively, an upside break of $4,350 immediate resistance can propel the Ethereum price towards the May 2021 high of near $4,381, and the all-time high (ATH) marked in November 2021 around $4,867 will be on their radars. On their way to the north, the $4,200 and the $4,300 thresholds could act as intermediate halts.
Ripple Buyers Struggle To Cheer Upbeat News
Ripple (XRP) dropped over 1.0% on Friday, Saturday, and Sunday, driven by a classic “buy the rumor, sell the news” reaction following a major legal update.
On August 7, the U.S. Securities and Exchange Commission (SEC) voted to drop its appeal against the Programmatic Sales ruling, leading to a Joint Stipulation of Dismissal with Ripple Labs Inc. — officially ending their nearly five-year legal battle.
Despite the legal win, profit-taking and uncertainty around a potential Exchange-Traded Fund (ETF) weighed on sentiment. On Friday, August 8, reports surfaced that BlackRock Inc. (BLK) had no plans to file for an iShares XRP Trust, casting doubt on hopes for an XRP-spot ETF — a key catalyst for many investors.
However, the narrative shifted again on Saturday, August 9, when Nate Geraci, President of The ETF Store, shared a post from crypto influencer Marty Party (with 225.9k followers on X), claiming the reports denying BlackRock’s plans for XRP and Solana (SOL) ETFs were false, sparked fresh speculation on Sunday but failed to trigger the price recovery.
Also read: XRP Price Jumps 10% as SEC and Ripple Abandon Legal Appeals
Apart from the U.S. SEC news, the latest behaviour of the XRP’s whale wallets, MVRV Data, and MDIA figures also favor the XRP bulls. The technical chart, however, needs a push to revive the buyers’ interests.
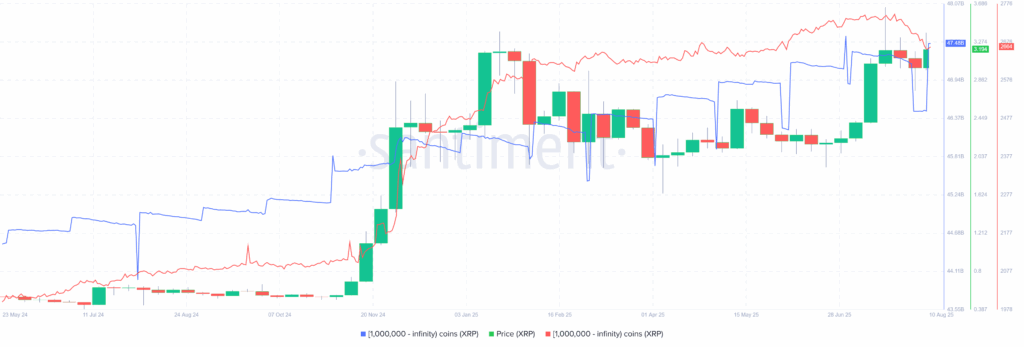
Starting with the XRP whale activity, wallets holding 1 million or more XRP hit a record high of 2,747 earlier in July but retreated to 2,664 by the end of August 10, with these wallets collectively holding roughly $47.48 billion in XRP, down from $47.59 billion marked on July 01 despite the latest run-up. With this, Ripple buyers show confidence and suggest further upside in prices, even as the number of wallets is declining.
XRP 1M+ Coin Balance By Number & Total Balance Held
Ripple’s MVRV and MDIA Return to Normal
The XRP’s 8% price rally in the last week came with a clear warning that the market was overheating, at least per the Santiment data. The MVRV (Market Value to Realized Value) ratio from Santiment, which compares the current price to the average cost basis of holders, spiked to risky levels when the XRP/USD pair hit a record high, resulting in the following pullback.
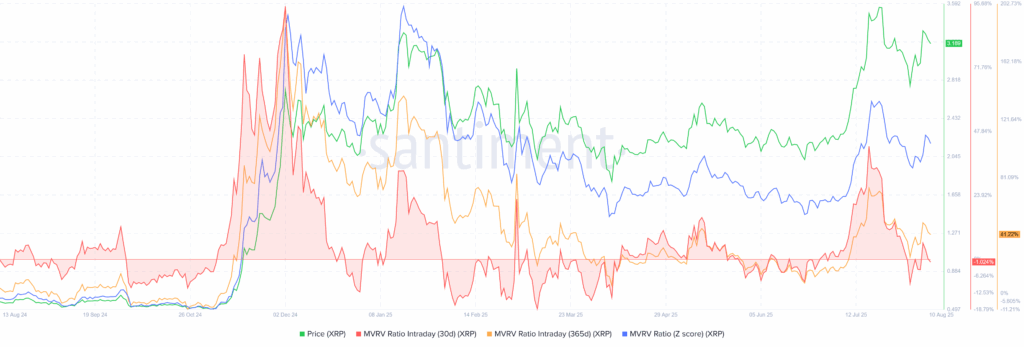
At its top, the XRP’s 365-day MVRV surged above +70%, close to 42% at the latest, showing most holders were deep in profits despite the latest retreat. Such elevated MVRV levels often signal that many investors may start taking profits, increasing the risk of a pullback in prices, which ultimately could be witnessed in Ripple’s performance after it hit the all-time high (ATH). In short, the rally pushed XRP into overvalued territory, and then the consolidation happened. It should be noted that the 30-day MVRV turned negative and suggests a potential pullback for the short term.
That said, the recent consolidation in the MVRV ratio and the XRP prices suggests a potential rebound.
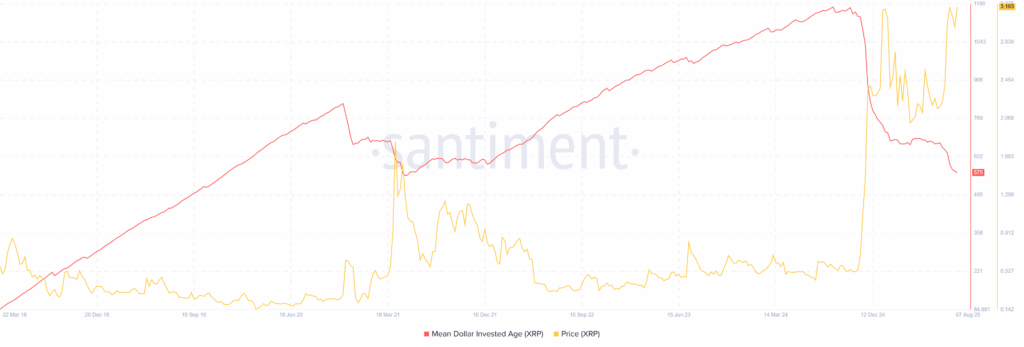
Adding to the optimism is the Mean Dollar Invested Age (MDIA) metric from Santiment, which tracks the average age of invested capital. As per the latest data, the XRP’s MDIA has been in a steady downtrend since early 2025, recently dropping to 575, its lowest level since May 2021. A falling MDIA signals older coins are back in motion, pointing to rising liquidity and healthy market activity.
To sum up, XRP’s July rally and following consolidation in prices join the key on-chain metrics to suggest a potential recovery, especially when the fundamentals are positive.
Ripple Price Technical Analysis Cites Consolidation
From a technical standpoint, XRP stays below an eight-month-old broad horizontal resistance zone surrounding $2.80-$2.95. The consolidation also took clues from the bearish MACD signals and downbeat but not oversold RSI line. However, the latest recovery in the RSI to the above 50.0 neutral conditions and a potential bullish crossover MACD joins the quote’s sustained trading beyond the key Exponential Moving Averages (EMAs) to suggest a gradual run-up in the Ripple price.
Ripple Price: Daily Chart Signals Gradual Run-up
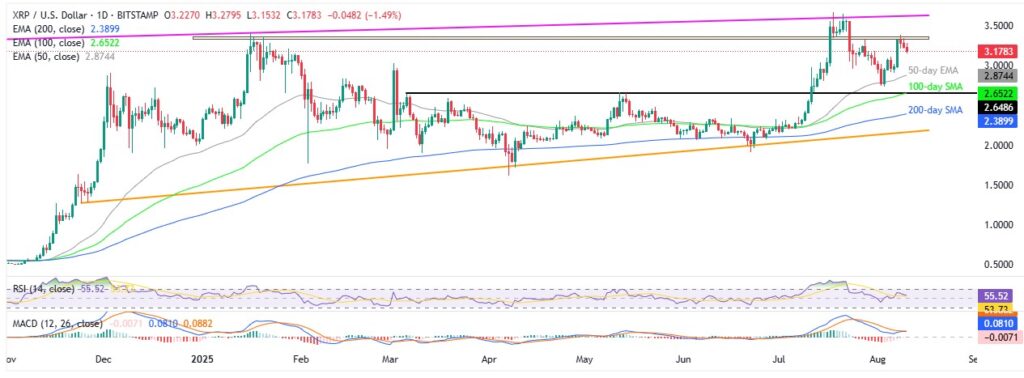
Even if the XRP prints a three-day downtrend on Sunday, it needs to provide a daily closing below the 50-day EMA support of $2.87 to regain the seller’s attention.
Even so, a five-month horizontal area comprising the 100-day EMA, close to $2.65, appears to be a tough nut to crack for Ripple bears. Following that, the 200-day EMA and an ascending trend line from late November, respectively near $2.39 and $2.15 at the latest, will be the last defense of buyers.
Alternatively, tops marked since mid-January, near $3.33-$3.36, could test the upside momentum. Beyond that, an ascending trend line from April 2021, near $3.62, and the XRP’s all-time high (ATH) of around $3.66, will be the key resistance to watch for buyers before they aim for the $4.00 threshold.
Conclusion
Last week’s crypto market paints a mixed, cautionary picture. While industry-positive news and strong altcoin performances attracted buyers, on-chain data and market cap trends suggest a need for caution. The divergence between Bitcoin and altcoins—alongside signs of euphoric sentiment among major crypto bulls, as shown in Santiment’s social trends data—raises doubts about the likelihood of a sustained rally.
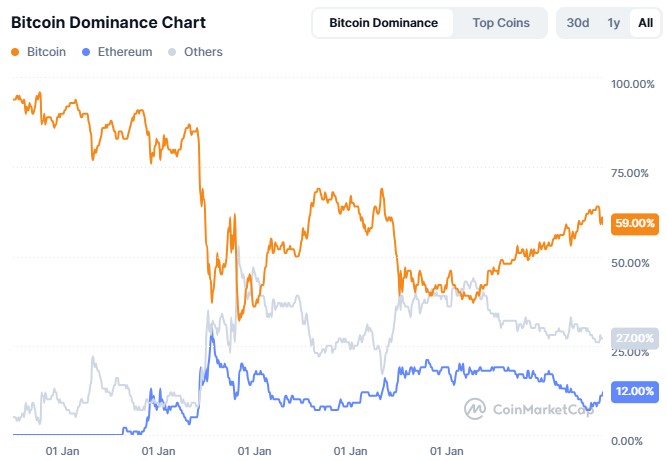
Data from CoinMarketCap backs this cautious view, showing a firm dominance of the ETH and others, let’s say altcoins, contrasting with Bitcoin’s underwhelming price action. It’s worth mentioning that Bitcoin’s dominance fell even as total crypto market capitalization rose. This often suggests a frothy, late-stage rally and challenges bulls, requiring them to be cautious.
Apart from the aforementioned signals, anxiety ahead of the next week’s U.S. Consumer Price Index (CPI) and Retail Sales for July, as well as other consumer-centric data and inflation signals, will also affect the momentum traders and require them to be logical. Furthermore, U.S. President Donald Trump’s trade and political actions will add to the market’s uncertainty.
That said, the U.S. Dollar’s weakness could help the cryptocurrencies, mainly the ETH and the XRP. However, Bitcoin may lag, and any gains in XRP are likely to be gradual rather than explosive.
Also read: Is Altseason Here? Find Out What Experts are Saying About this


