- Ethereum recovery from 6-week low stalls as technical resistance challenges rally despite ceasefire relief, strong ETF inflows, and bullish on-chain signals.
- ETH ETF inflows stay strong after seven-week streak, aiming for biggest 2025 monthly gain.
- Growing whale and fund holdings plus higher profitable transactions support ETH/USD gains.
- 200-day EMA joins support-turned-resistance to set $2,470 as key resistance.
Ethereum (ETH/USD) is losing upside momentum near $2,440 during Wednesday’s European session, struggling to extend its two-day winning streak as bulls face a strong technical barrier around $2,470.
The recent rebound from a six-week low was supported by optimism over the Israel-Iran ceasefire, rising ETF inflows, and bullish on-chain signals. However, the rally now faces stiff resistance from the 200-day Exponential Moving Average (EMA) and a five-week-old ascending trendline that once served as key support, both converging near $2,470. This zone is proving difficult for bulls to break, threatening to halt ETH’s short-term recovery.
Iran-Israel Ceasefire, Powell’s Testimony Lifts Sentiment
After a 12-day conflict and U.S. intervention, Iran and Israel agreed to a ceasefire, easing tensions and reducing pressure on global energy supplies and the strategic Strait of Hormuz shipping lane. The long-awaited truce boosted global risk sentiment, allowing cryptocurrencies like Ethereum to recover recent losses—though the rally is now pausing amid consolidation.
Adding to the geopolitical backdrop, U.S. President Donald Trump criticized escalating war rhetoric in the Middle East and warned regional allies about the potential withdrawal of U.S. support or aid, raising fresh diplomatic concerns.
Meanwhile, Federal Reserve Chairman Jerome Powell, in his bi-annual testimony, maintained a “wait and watch” stance on monetary policy. His dovish tone supported riskier assets, helping Ethereum hold onto its recent recovery gains despite mounting technical resistance.
ETF Inflows Keep ETH Buyers Hopeful
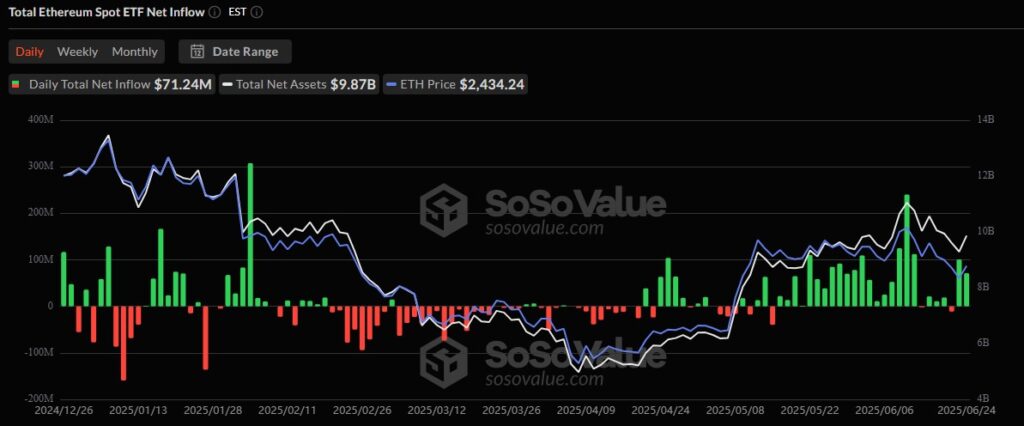
InInstitutional support for Ethereum continues for the seventh consecutive week, rebounding after the first outflow in four days recorded last Friday. This steady inflow positions the market for what could be the largest monthly institutional investment in ETH for 2025, highlighting strong confidence from major investors.
According to SoSoValue, U.S. Ethereum spot Exchange-Traded Funds (ETFs) recorded a net inflow of $71.24 million on June 24, marking the second straight day of gains following a $11.43 million outflow on June 20—the first daily outflow in four days.
Source: Sosovalue.com
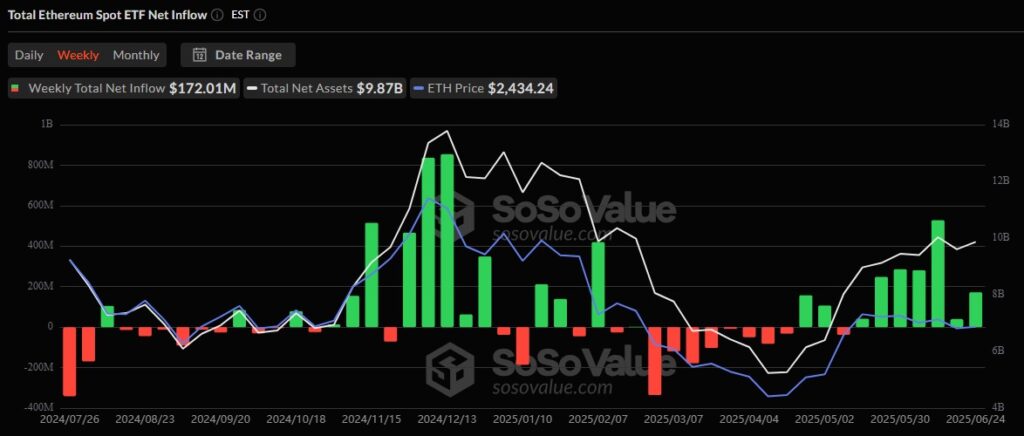
It’s worth noting that U.S. Spot ETH ETFs have seen six consecutive weeks of net inflows, with the most recent weekly total reaching $172.01 million, according to SoSoValue.
Source: Sosovalue.com
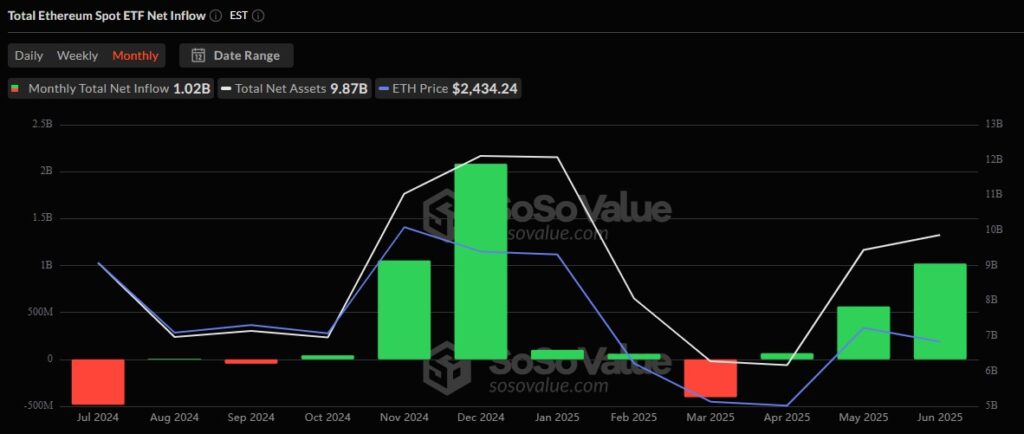
With this, June’s net inflow into the U.S. Ethereum spot ETFs hit a yearly high of $1.02 billion, marking the third straight monthly increase—a strong sign that institutional buying may soon drive ETH/USD prices higher.
Source: Sosovalue.com
ETH Derivatives Also Flash Bullish Signals
AAlongside positive institutional inflows, derivatives data also reflect growing trader optimism for Ethereum (ETH). According to Santiment, open interest in the Ethereum derivatives market rose around 11.70% since the start of the week, reaching $9.97 billion on June 25. This increase suggests a fresh wave of bullish trader accumulation, likely triggering new capital inflows into Ethereum derivatives.

Source: Santiment
Extra On-Chain Signals
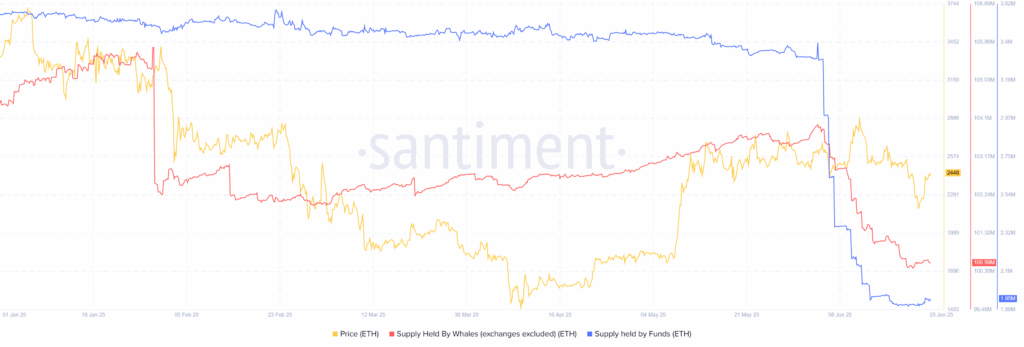
Beyond the earlier points, Santiment data shows whales and funds increasing their Ethereum supply holdings. This holding pattern signals a bullish investor bias, pointing to further potential gains in ETH prices.
Source: Santiment
Additionally, Santiment’s Ratio of Daily On-Chain Transaction Volume in Profit to Loss has remained well above the 1.00 mark—reaching around 1.214 at press time. This indicates that more transactions are being made at a profit, signaling strong interest from Ethereum traders and reinforcing a bullish outlook for ETH.
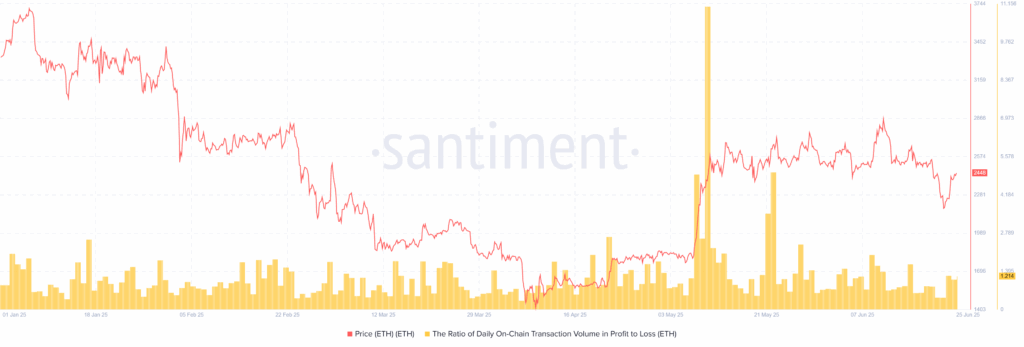
Source: Santiment
Short Liquidations Suggest Bullish Bias
On a different note, CoinGlass data shows that short liquidations exceeded long liquidations for two consecutive days before today’s figures of $2.81 million (shorts) and $6.32 million (longs). This creates a long-to-short ratio of 0.83, signaling more active long positions and highlighting the bullish bias among ETH traders.

Source: CoinGlass.com
Technical Analysis
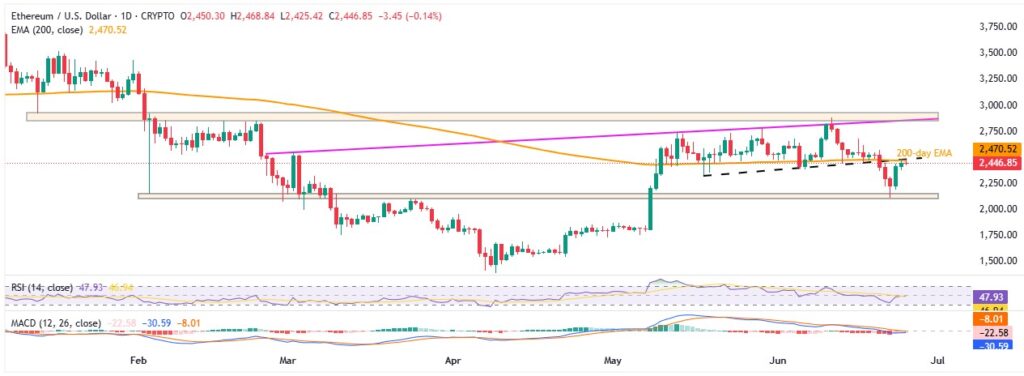
On the daily chart, Ethereum (ETH/USD) is fighting to hold its recovery from a multi-month horizontal support level. It now faces a key resistance formed by the 200-day Exponential Moving Average (EMA) and a five-week-old support line turned resistance. The 14-day Relative Strength Index (RSI) has bounced up from near oversold territory, while the Moving Average Convergence Divergence (MACD) is easing its bearish momentum—both pointing to potential upside ahead.
ETH/USD: Daily chart signals further recovery
Source: Tradingview
The RSI climbing into the neutral zone, along with an imminent bullish crossover on the MACD, supports ETH/USD’s rebound from the horizontal support zone between $2,150 and $2,100—a level held since early February. This indicates growing bullish momentum and sets the stage for a potential break above immediate resistance near $2,470, marked by the 200-day EMA and a multi-week ascending trendline that previously served as key support.
If bulls clear this hurdle, the next targets could be the $2,610–$2,620 range, followed by a challenge of major resistance near $2,850, where an upward trendline from late February meets a five-month horizontal cap.
On the downside, the $2,150–$2,100 support zone remains a strong defense. However, a decisive break below $2,150 could open the door for a drop toward the psychological $2,000 level, and potentially further down to the early-May swing high around $1,870.
Conclusion
Ethereum (ETH/USD) continues its recovery, supported by easing geopolitical tensions and improving market sentiment. The Israel-Iran ceasefire, following U.S. intervention, has boosted risk appetite globally, creating a more favorable backdrop for cryptocurrencies. On-chain data from Santiment shows increasing ETH holdings by whales and institutional funds, alongside a three-day rise in profitable transactions — both signaling growing investor confidence and bullish momentum.
These fundamental tailwinds, combined with recent technical resilience near key support levels, position Ethereum to challenge and potentially break above the immediate resistance near $2,470. A clear move beyond this level could open the door to further upside in the near term.


