- Solana retreats from fortnight high, ending three-day run as bulls face fresh test.
- SOL breaks past $148 after REX Shares hints at staking ETF, flips key resistance to support.
- SOL/USD breakout to $168 meets resistance from sluggish network activity, funding rates.
Solana (SOL/USD) slips nearly 2% to around $150 during Monday’s European session, snapping a three-day winning streak after hitting a two-week high.
During the last week, SOL rallied on REX Shares’ staking ETF buzz, breaking above the key $148 resistance—which now acts as support. However, mixed on-chain data and market caution ahead of key US economic releases and Fed Chair Powell’s upcoming speech appear to have triggered the current pullback toward the $148 support zone.
Bloomberg’s Senior ETF Analyst Eric Balchunas spotted a June 28 post from REX Shares on X, announcing its upcoming REX-Osprey SOL and staking ETF. The fund is designed to track Solana’s performance while generating yield through on-chain staking, with a launch expected soon. Balchunas also shared an email screenshot confirming that REX Shares has addressed the SEC’s comments, adding, “So they are good to launch, it looks like. Wow.”
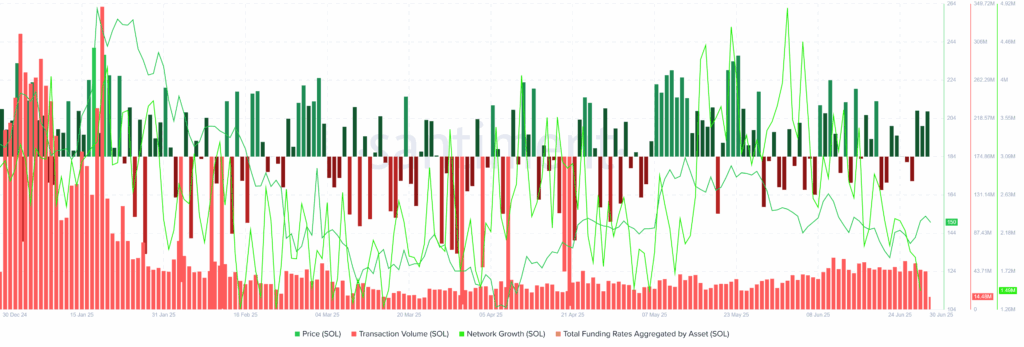
Meanwhile, Solana’s network growth has fallen to its lowest level since May 6, hovering around 1.49 million. Total funding rates aggregated by SOL also broke a three-week uptrend by posting a -0.000735% weekly loss before rebounding to 0.003068% for the June 26–30 period. Notably, transaction volume remained strong during last week’s price recovery, signaling increased trader participation that could support further gains.

Source: Santiment
It’s worth noting that caution ahead of this week’s speech by Fed Chair Jerome Powell, upcoming US employment data, and mixed risk sentiment continues to weigh on SOL/USD, as uncertainty grows over whether REX Shares will launch its ETF in July. However, confirmation about SOL ETF could join the technical breakout to propel the prices.
Technical Analysis
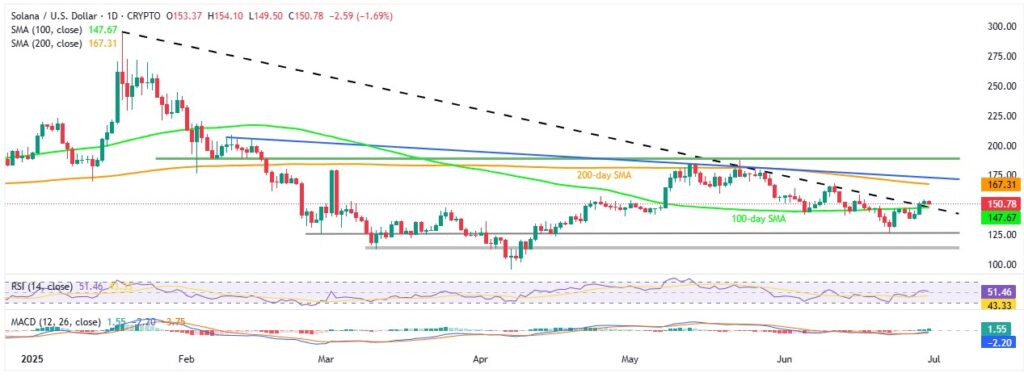
Solana’s pullback isn’t supported by technical indicators, as the 14-day Relative Strength Index (RSI) remains above the 50.00 mark and the Moving Average Convergence Divergence (MACD) continues to flash bullish signals. This suggests that positive momentum still underpins the recent technical breakout, despite the ongoing price dip.
SOL/USD: Daily Chart Favors Bulls

Source: TradingView
With that, the SOL/USD pair is unlikely to fall back below the $148.00 support zone, which includes the 100-day Simple Moving Average (SMA) and a former resistance trendline from January.
Still, any recovery needs confirmation above the recent peak near $155.00 to open the door toward the 200-day SMA at $167.00 and a descending resistance line from early February near $173.50.
Alternatively, if Solana fails to hold above $148.00, a drop below Friday’s low of $137.27 could follow, exposing a four-month-old horizontal support area around $126.00.
That said, stronger bearish conviction may only emerge if the pair breaks below a key 3.5-month-old support zone around $113.00—clearing the way for a potential test of the yearly low at $95.33.


