
- Major cryptocurrencies consolidated gains, with Bitcoin and Ethereum posting mild weekly positives while Ripple snapped four-week uptrend.
- Long liquidations stood out as key driver behind the market’s recent shift.
- Cooling political pressure for Fed rate cut and leadership change contributes to crypto consolidation.
- Anxiety ahead of July 30 White House ‘Crypto Report’ and FOMC also challenged BTC, ETH and XRP optimists.
Global crypto market witnessed a roller coaster ride during the fourth week of July as major coins dropped initially before recovering to close the week with mild gains.
Bitcoin (BTC/USD) stabilized after retreating from a new all-time high whereas Ethereum (ETH/USD) refreshed yearly top but ended the week with only mild gains. Meanwhile, Ripple (XRP/USD) posted the first weekly loss in five following its stellar run-up to refresh the record top. That said, BTC, ETH and XRP all three print mild gains on Sunday around $118,000, $3,790 and $3.18 in that order.
The ‘Crypto Week’ Moves
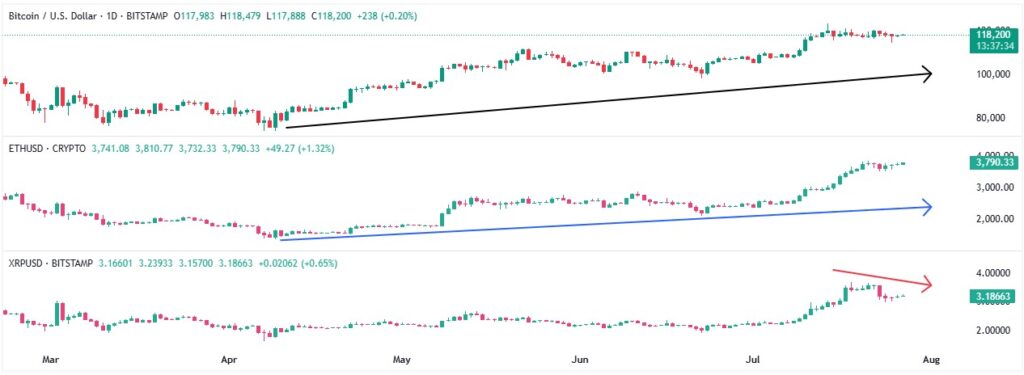
Among major catalysts, mixed U.S. data and easing political pressure on the U.S. Federal Reserve (Fed) over rate cuts and leadership change gained major attention. Also important to watch were a jump in the long liquidations, upbeat Ethereum (ETH) validator queue and fresh Bitcoin (BTC) accumulation by top industry names like Strategy and Trump Media.
During the last week, U.S. President Donald Trump visited the Fed’s construction site and met Chairman Jerome Powell. The Republican Leader rejected chatters of readiness to fire Powell by saying, “it’s not necessary”. Trump also added that there was “no tension” as he spoke with Powell about interest rates. This could be cited as the key catalyst behind the late week U.S. Dollar recovery, which in turn weighed on other risk assets like cryptocurrencies and gold. Even so, the US Dollar Index (DXY) portrayed the first weekly loss in three as flash readings of July Purchasing Managers Index (PMI) and June’s Durable Goods Orders failed to impress Greenback buyers. That said, the spot Gold (XAU/USD) marked a second weekly decline but the Wall Street benchmarks refreshed all-time high before cooling off.
Elsewhere, Wall Street Journal (WSJ) signaled Trump’s positive shift toward trade deal with China before late July talks, favoring cautious optimism along with recent upbeat headlines about progress on the U.S.-Australia trade deal negotiations. On the same line were comments from US Treasury Secretary Bassent and US Commerce Secretary Lutnick stating, “U.S. in pretty good place with China on trade”, and the EU really wants to make a deal (with the U.S.), respectively. However, the Financial Times (FT) reported the EU’s on-hand plan to retaliate US tariffs if needed, which in turn tests the trade-linked positive vibes.
On the geopolitical front, tensions between Thailand and Cambodia escalated, pushing the United Nation’s Security Council (UNSC) to have an emergency meet. Further, Trump’s weapon supplies to Egypt and Ukraine, as well as threats to Iran, also contributed to the global war fears and challenged the risk assets like cryptocurrencies.
In the crypto universe, Strategy (formerly ‘MicroStrategy’) and Trump Media & Technology Group (TMTG) accumulated more Bitcoins to their treasury. That said, Strategy announced plans to launch 5 million shares of a new preferred stock to raise funds for corporate operations and additional Bitcoin purchases. On the other hand, TMTG became the world’s fifth-largest corporate holder of Bitcoin with around $2.0 billion BTC treasury per the latest prices. Meanwhile, Trump’s proposed $600 Minimis Crypto Tax Exemption joined the post ‘crypto week’ optimism to keep buyers hopeful before the White House’s July 30 release of Bitcoin Reserve Plan in its ‘crypto report’, following a 180-day review.
Talking about the position liquidation, it is the forced closing of a trader’s positions by a broker due to insufficient margin. This data reveals whether long (buy) or short (sell) positions were closed, helping explain recent price movements. Typically, heavy long liquidations happen during a downtrend and suggest short-term bearish sentiment.
The latest data from CoinGlass for July 20 to 27 marked total liquidations for BTC, ETH and XRP hitting a massive $1.57 billion, with Bitcoin accounting for $497.28 million, Ethereum contributing $866.15 million and Ripple marked $208.93 million liquidations. Looking at the details, Bitcoin’s long (buy) liquidations were $317.04 million comprising 63.75% of the total while short (sell) liquidations were $180.24 million forming 36.25% of the total. That said, Ethereum saw $519.62 million (59.99%) of long liquidations and $346.53 million (40.01%) short liquidations. More importantly, XRP long liquidations were 79.56% of the total, with $166.24 million, whereas short liquidations were 20.44% with $42.70 million. Hence, this suggests heavier long liquidations in XRP justifying the latest fall in Ripple prices.
Looking forward, crypto traders will keep eyes on the White House’s ‘crypto report’ comprising details of Trump administration’s audacious ‘Bitcoin Reserve Plan’ and other regulations. On a broader front, advance estimations of the U.S. second quarter (Q2) Gross Domestic Product (GDP), monetary policy meeting of the Federal Open Market Committee (FOMC), Core PCE Price Index(the Fed’s favorite inflation gauge) for June, and monthly U.S. employment report for July will together offer a busy week.
Bitcoin Buyers Keep Control Even As Rally Stalls
Let’s talk about the crypto majors in detail!
Despite falling on four of the past seven days, Bitcoin (BTC/USD) ended the week with mild gains and has edged higher of late. Signals like position liquidations, softening inflows into the Exchange-Traded Funds (ETFs) and a few on-chain signals hint at BTC top. However, key industry players continue to accumulate their strategic reserves with the cryptocurrency major, allowing BTC buyers to stay optimistic about further upside potential.
Notably, Bitcoin’s sustained hold the seven-month resistance, now turned support, has bulls targeting the next key level: an ascending trendline resistance from March. This resistance line forms part of a medium-term ‘Rising Wedge’ chart pattern and aligns with growing chatters of a potential move toward $126,000 for BTC/USD. That said, BTC prices remain range-bound within a two-week triangle surrounding $120K-$116K.
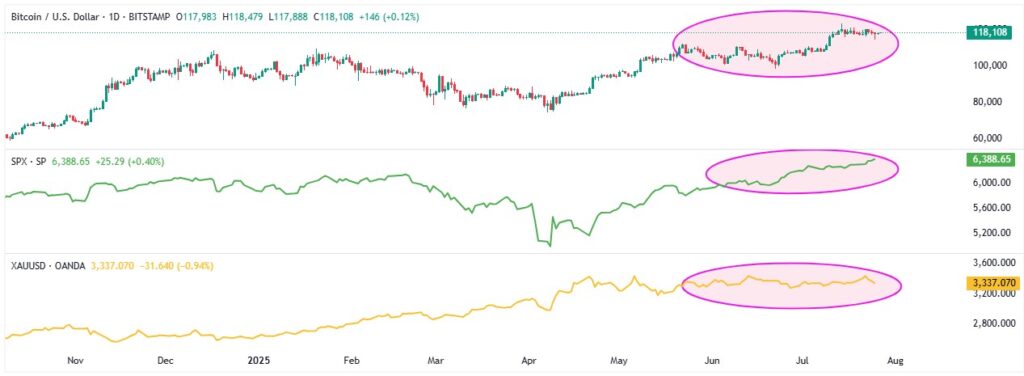
Starting with the correlation chart from TradingView, there’s a clear, sustained linear relationship between Bitcoin (BTC/USD), the S&P 500 Index (SPX), and Gold (XAU/USD), despite the recent divergence of the SPX. This correlation holds even as Bitcoin navigates rising economic uncertainty from U.S. tariff threats, as well as mixed signals surrounding the Fed’s future moves and Powell’s position. The trend highlights growing market confidence in cryptocurrencies as a new alternative safe haven.
On-Chain, ETF Signals
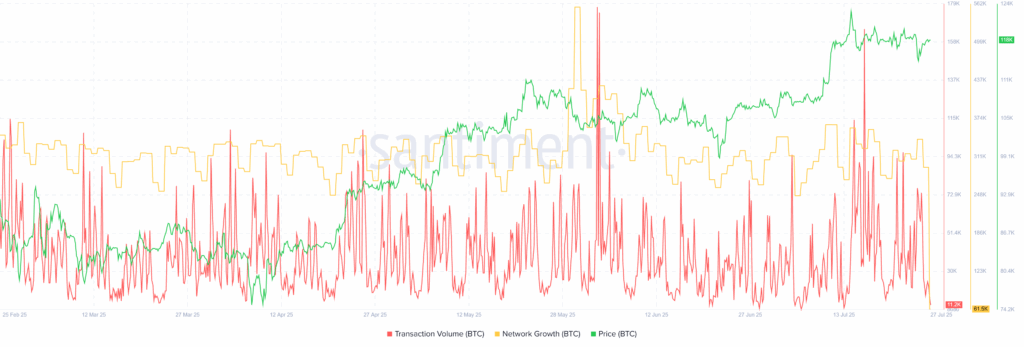
Starting with the Transaction Volume and Network Growth, both of which challenging the BTC buyers. Transaction Volume is the agreegate amount of BTC tokens across all daily transactions took place on the network. Meanwhile, Network Growth means the amount of new addresses that transferred a given coin, BTC in this case, for the first time.
Santiment’s on-chain data reveals Bitcoin price hit a fresh record high, but metrics like Transaction Volume and Network Growth edged lower. This points to a growing exhaustion among the BTC bulls and a potential top in the prices. Transaction Volume is the agreegate amount of BTC tokens across all daily transactions took place on the network. That said,
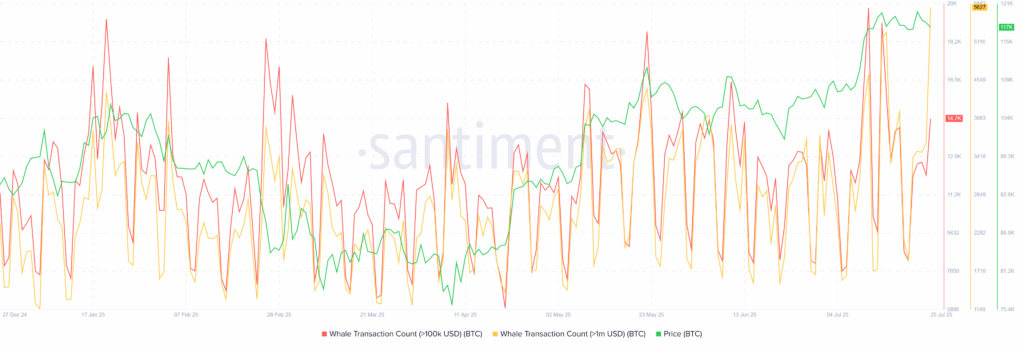
Moving on, Santiment’s data on whale transactions, wallets holding over 100K and 1.0 million BTC, shows a sharp spike during Bitcoin’s all-time high. However, despite the BTC’s following price consolidation, whale transaction activity isn’t comforting, with transactions of wallets holding more than 1.0 million BTC growing but not so much with wallets holding over 100K BTC. This indicates waning interest from large holders and presenting a challenge for BTC/USD bulls.
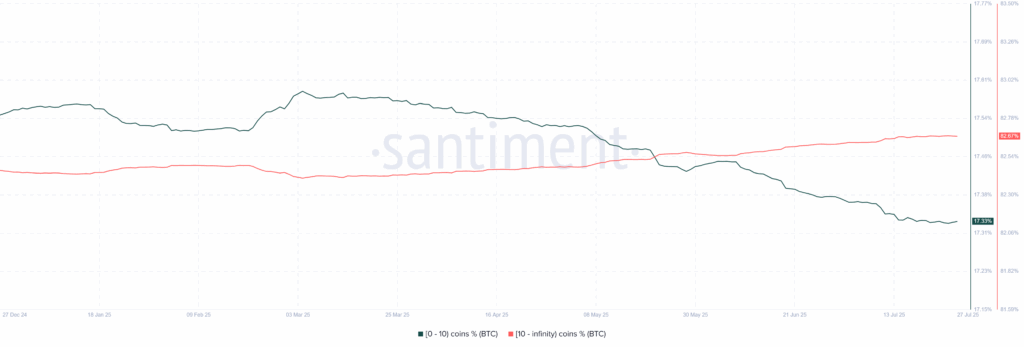
Elsewhere, recent data from Santiment highlights a consolidation in Bitcoin’s supply distribution between large holders (whales) and retail investors based on wallet size. Since July 17, the wallets holding 0 to 10 BTCs constitute a steady 17.33% of total supplies while whales (wallets holding more than 100K BTC) form 87.67% of total supplies till July 27. Even so, the major trend of accumulation from whales keeps the BTC buyers hopeful.
Moving on to the net inflow to the U.S. spot Bitcoin ETFs, the weekly figureclosely missed being the negative due to the increase in Thursday and Friday. Even so, net inflow figures for the week ended on July 25 marked the smallest increase since early June with $72.06 million. This suggests cautious bias among institutional players and could be spotted on the following weekly chart.
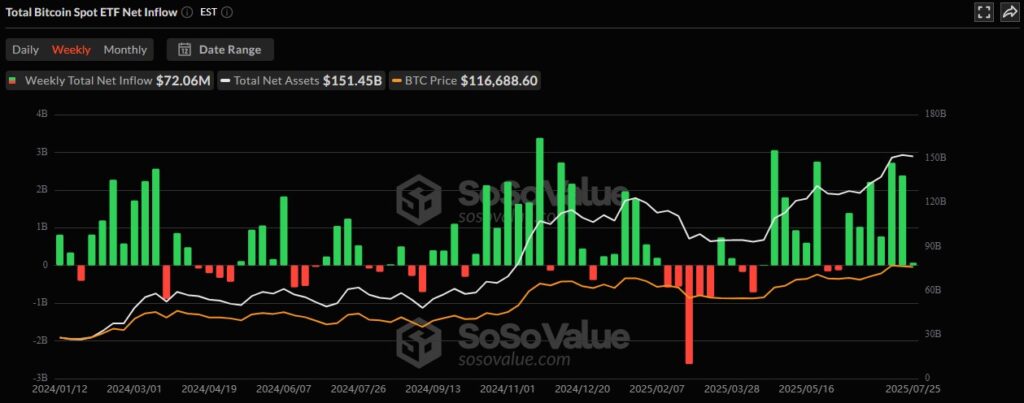
Recent figures from SoSovalue indicate a notable dip in institutional demand for Bitcoin, with U.S. spot BTC ETF inflows cooling off after hitting a seven-week peak during mid-July. However, the net inflows still mark a seventh straight week of positive inflows. For the week ending July 25, total inflows reached $72.06 million, contributing to a fourth consecutive monthly inflow that totals approximately $5.85 billion for July, the highest since November 2024.
Technical Analysis Pokes BTC Bulls
As per the daily chart of Bitcoin (BTC/USD), the crypto leader remains within a two-week range of $116,000–$120,000 after breaking above a key resistance line from mid-December. The 14-day Relative Strength Index (RSI) stays neutral but the Moving Average Convergence Divergence (MACD) flashes bearish signal, supporting ongoing consolidation within a broader bearish “Rising Wedge” pattern between $109,000 and $126,000.
BTC/USD: Daily Chart Suggests Bullish Consolidation
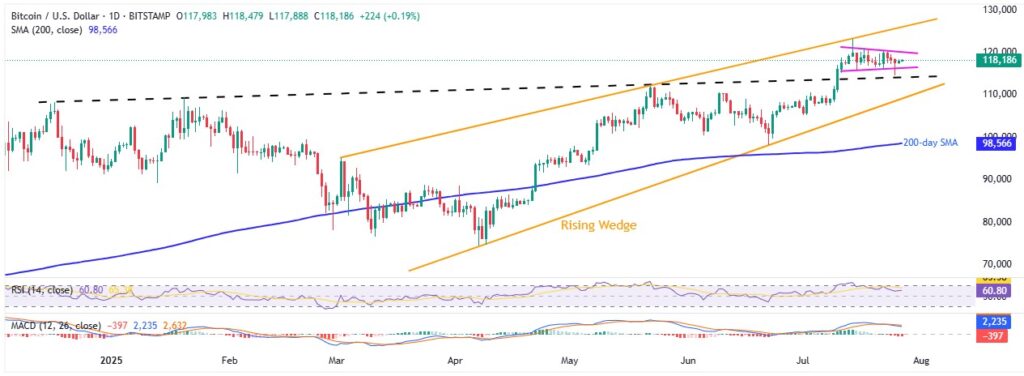
If Bitcoin (BTC/USD) breaks above the $120,000 resistance on a daily closing basis, it may climb toward the Rising Wedge top near $126,000 before another consolidation.
A breakout beyond that would invalidate the bearish chart pattern and open the door to the widely discussed $135,000 target for the BTC, aligned with the ascending resistance from March 2024.
On the flip side, a daily closing below $116,000 could pull BTC toward the wedge’s base near $108,000, and a break of that would confirm a bearish move with a theoretical target of $60,000. However, the 200-day Simple Moving Average (SMA) at $98,570 and April’s low of $74,600 may offer strong supports during the fall.
Ethereum Bulls Tread Carefully
Be it a pullback in the net inflows to the U.S. spot ETH ETFs or ETH/BTC pair’s retreat from key resistance, not to forget cautious mood of traders per the social trends data, the Ethereum (ETH/USD) price portrays the cooling off period among the bulls. Also favoring the consolidation pattern were data from ETH Validator Queue and mixed bias about Ethereum Gas Limit.
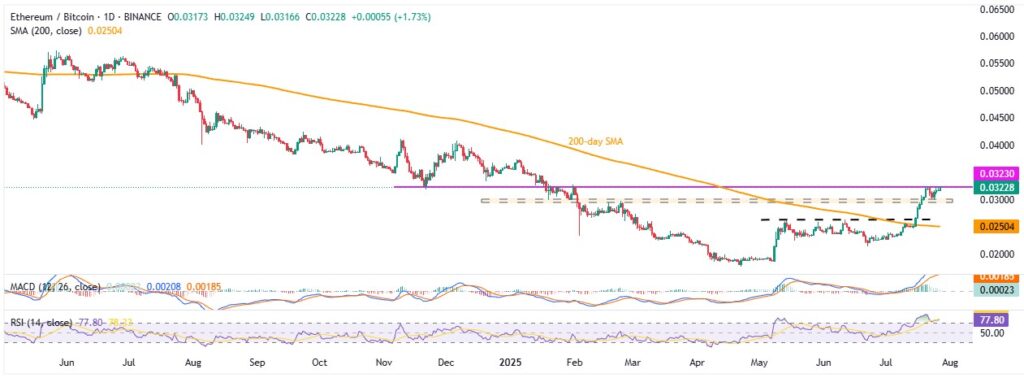
Starting with the ETH/BTC chart, bulls retreated from an eight-month-old resistance before bouncing off a horizontal support zone since mid-January. However, a sustained break above the 200-day Simple Moving Average (SMA) and key resistance levels from both May and January keep the buyers hopeful. The same, in turn, singles that Ethereum witnessed a pullback but is back to challenging the key resistance.
That said, the ETH/BTC ratio again approaches the key 0.03230 horizontal hurdle comprising levels marked since late 2024, a break of which could trigger stellar run-up. Even if the prices witness another round of fall, buyers can stay optimistic beyond February’s high of 0.02968, forming part of the key horizontal support zone.
Validator Queue Tests ETH Bulls
Ethereum’s validator exit queue hit an 18-month high, raising concerns among crypto optimists as roughly $2.3 billion worth of ETH lined up to leave the network. This spike signaled a major shift in validator behavior, sparking fears of weakening confidence in Ethereum’s proof-of-stake system — a core mechanism securing the network by requiring validators to lock in ETH to verify transactions.
However, market anxiety eased soon after. The validator entry queue picked up momentum, and the exit queue began to decline. Staking platform Everstake confirmed that the trend reflected normal network activity rather than a mass exit. Many validators are likely rotating operators, restaking, or taking profits — not abandoning Ethereum.
At its peak, the validator exit queue stretched to 19 days before pulling back to 11. Meanwhile, the entry queue now shows 310,000 ETH waiting to join, implying a 5-day wait — a healthy signal that participation remains strong.
That said, the validator queue data suggests that number of ETHs (by the stakers) requesting to leave/enter the Ethereum’s proof-of-stake system, as well as the likely numbers of wait period in days due to processing cap.
On-Chain Details Flag Fears
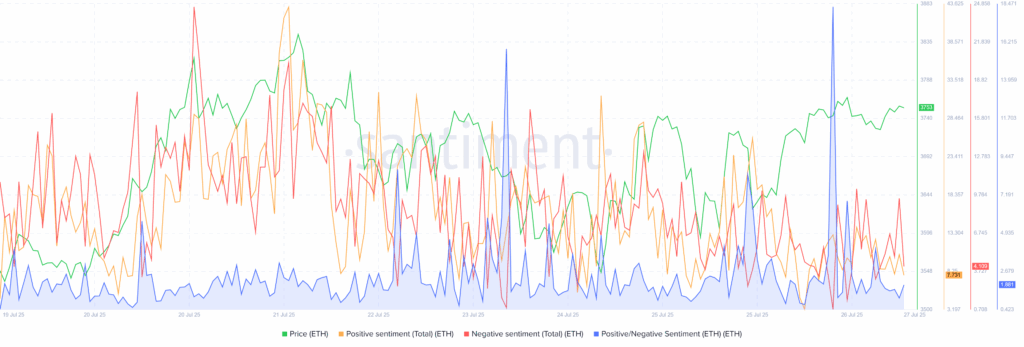
Apart from the ETH validator queue data, a comparison of the Positive/Negative Sentiment on the social media platforms surrounding Ethereum, compared to the prices, also shows cautious mood among the traders.
As per the below-mentioned graph from sentiment, early last week, the crowd turned cautious with higher ‘Negative Sentiment’ activating ETH profit-booking wave after a quick push to the yearly high. The following consolidation, however, gained support from the ‘Positive Sentiment’, backed by increased talks of ETH’s jump $4K and beyond. This helped Ethereum prices to edge higher afterwards. That said, the Positve/Negative Sentiment Metric remains sustainably beyond the 1.0 mark, suggesting steady confidence in the second-best crypto currency. However, buyer’s inability to push prices much higher signals importance of the latest peak as the key resistance.
ETH ETF Optimism Remain Intact
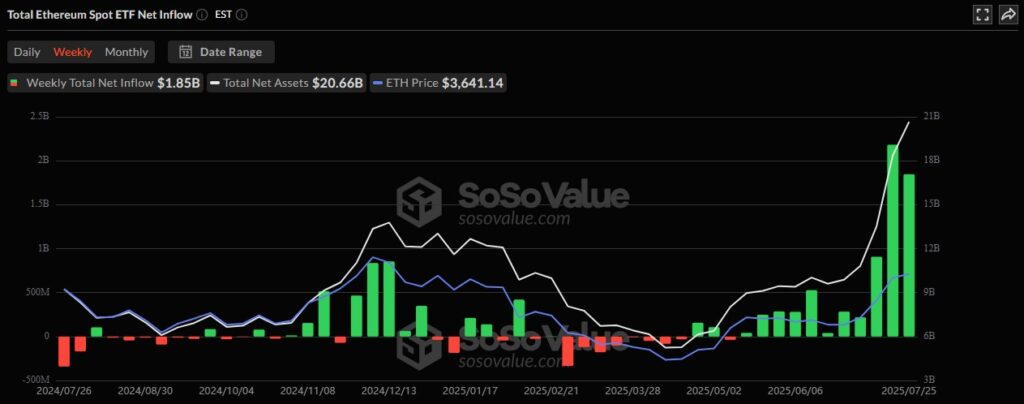
Despite the cautious view due to the previously mentioned long liquidations, validator queue and sentiment data, overall inflows to the U.S. spot ETH ETFs remain firmer and keep the buyers hopeful even as the total figures eased of late. That said, U.S. spot ETH ETFs reported the 11-week inflow streak to keep the Ethereum buyers hopeful. Also important to note that the weekly ETF inflows eased from a record high of $2.18 billion, reported the last week, to $1.85 billion for the week ended on July 25.
Additional Catalysts
Apart from the aforementioned catalysts, the latest reduction in the retail and whale buying of Ethereum also challenge the ETH bulls, especially when the upside momentum cooled of late.
As per the latest supply distribution data from Santiment, Ethereum whales—wallets holding over 100K ETH—have cut their holdings by approximately 39,757 ETHs this week, down 0.04%. On the contrary, the retail traders, wallets holding less than 10 ETHs, reduced their holding by 13079 ETHs, or 0.23%, from July 20 to July 27.
Alternatively, Vitalik Buterin, the co-founder of Ethereum, said on X that almost exactly 50% of stake is voting to increase the L1 gas limit to 45M. “The gas limit is already starting to increase, now at 37.3M,” Buterin added. The update gained major attention after a 21% jump into the Ethereum gas limit to the record high of more than 37 million (37M) gas, with almost half of all validators now supporting the increase, setting the stage towards a new limit of the full 45 million (45M) units.
It’s worth noting that there prevails mixed reaction to the news as some consider it as compromising network security over performance as gas limit increase signals more transactions processed but smaller participants to the ETH systems can’t afford advanced instruments, high bandwidth and heavy storage.
ETH/USD Daily Chart Keeps Buyers Hopeful
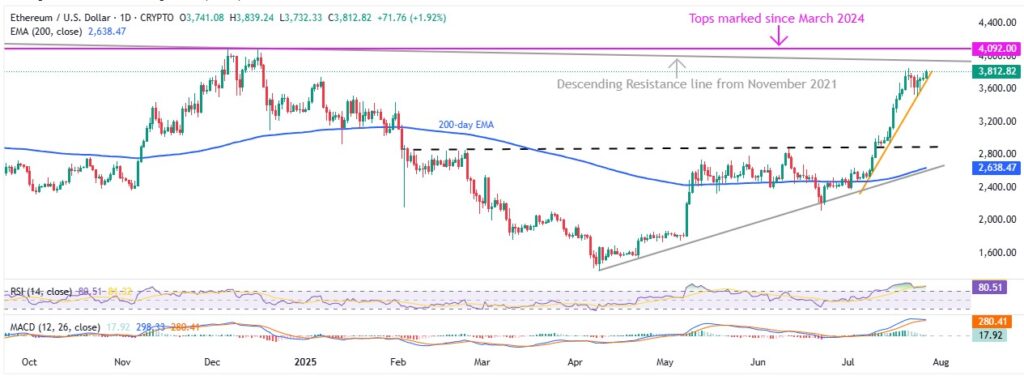
The last Monday’s Doji candlestick at the yearly high and the following pullback in the 14-day Relative Strength Index (RSI) from overbought territory seems to have favored the ETH/USD sellers. However, a two-week-old ascending support line challenged the quote’s further downside despite looming bear cross on the Moving Average Convergence Divergence (MACD) indicator. That said, the RSI is again rising into the overbought territory and so do the price, which in turn highlights the importance of the immediate resistances as the key hurdles.
The ETH/USD pair’s current rise aims for the yearly high of $3,858 and a descending resistance line from November 2021, close to $3,950 at the latest, to convince buyers. Also acting as a strong upside hurdle is horizontal area surrounding $4,090 – $4,100, comprising tops marked since March 2024.
Alternatively, a downside break of the immediate support line surrounding $3,700 could convince sellers to retake control. The same could direct bears toward the tops marked in late January around $3,525 and $3,437.
However, the ETH’s weakness past $3,437 makes it vulnerable to approach the $3,000 psychological magnet and ascending support line from February, previous resistance surrounding $2,890. That said, the 200-day Exponential Moving Average (EMA) and rising trend line from early April, respectively near $2,638 and $2,590, appear tough nuts to crack for the bears afterward.
Ripple Flashes Warning Signs for Bulls
A strong long liquidation among the Ripple (XRP/USD) traders, discussed earlier, and a lack of response from the U.S. Securities and Exchange Commission (SEC) on whether it will withdraw its appeal in the Ripple case, following multiple closed-door meetings, challenges the XRP bulls.
On the same line could be the recent consolidation in the XRP whale activity after hitting record highs.
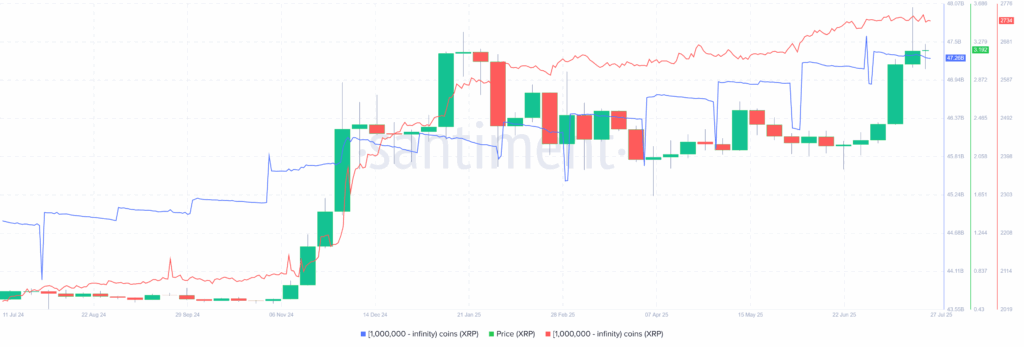
As per the Santiment data, the number of wallets holding 1 million or more XRP hit a record high of 2,747 earlier in July but retreated to 2,734 by the end of July 27—with these wallets collectively holding roughly $47.26 billion in XRP from $47.59 billion marked on July 01. With this, Ripple buyers show lack of confidence and challenge further upside in prices, even as the bears are resistant in reclaiming the control.
XRP 1M+ Coin Balance By Number & Total Balance Held
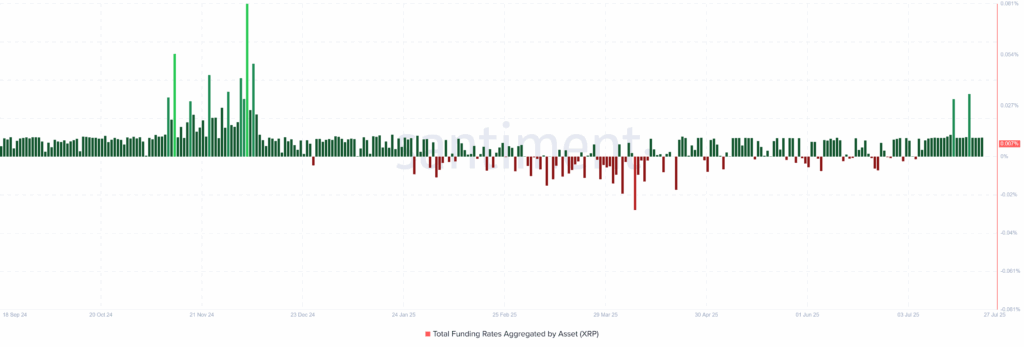
Meanwhile, XRP’s total aggregated funding rates surged to an eight-month high of 0.027% on Wednesday, before retreating to 0.007% at the latest, indicating sturdy long-position demand and upbeat investor interest. This suggests that newcomers entering the market must now pay higher fees to hold bullish positions. However, while such elevated funding rates often align with increased optimism, they don’t guarantee sustained upside—as historically, extreme readings have sometimes preceded local tops or price reversals in XRP/USD.
XRP Total Funding Rates Aggregated
From a technical standpoint, XRP has broken decisively above the key horizontal resistance comprising levels marked since early December 2024, close to $2.83-$2.95. This breakout, reinforced by the RSI line’s return from the overbought territory, backs the latest U-turn in prices from the said horizontal resistance-turned-support to keep the buyers hopeful even as MACD signals are dicey of late.
XRP/USD: Daily Chart Signals Recovery
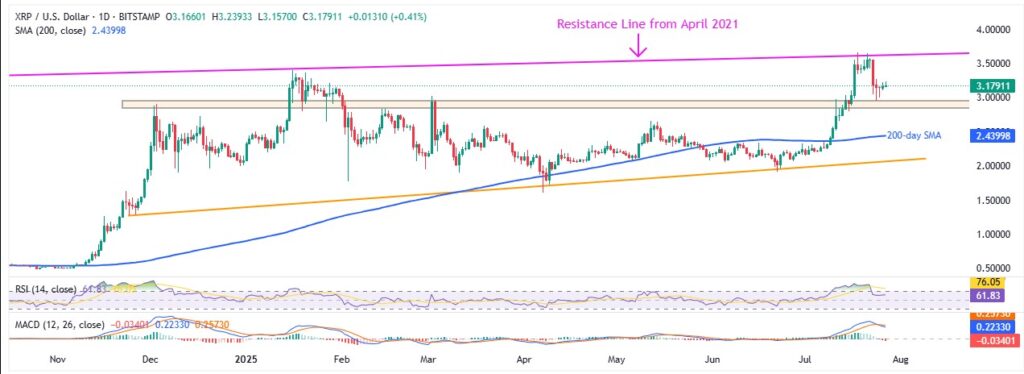
XRP/USD keeps the early-July breakout of the multi-month resistance zone surrounding $2.83-$2.95, backed by upbeat RSI, ignoring dicey MACD signals. With the recent rebound from the said zone, the Ripple bulls are likely to approach early 2025 peak of $3.40. However, an upward-sloping resistance line from April 2021, close to $3.64 by the press time, precedes the all-time high marked on July 18 near $3.66 to challegen the XRP bulls afterward. In a case where the XRP/USD price remains firmer past $3.66, the odds of witnessing a rally toward the $4.00 threshold can’t be ruled out.
Meanwhile, a downside break of $2.83 could trigger heavy consolidation in the Ripple price, dragging it back toward the 200-day SMA support of $2.44 and then to a seven-month-old ascending trend line support surrounding $2.06, adjacent to the $2.00 round figure support.
Conclusion
Looking ahead, crypto traders await the Trump administration’s upcoming ‘crypto report’ and its much-anticipated ‘Bitcoin Reserve Plan’. If the report backs law enforcement efforts to seize around 200,000 BTC—an idea that’s been widely discussed—and shows progress on Trump’s proposed crypto tax exemption (the $600 “minimis” rule), it could boost market optimism. That said, Bitcoin and Ethereum are likely to benefit most from such news, while XRP may react less strongly due to a lack of major positives for Ripple.
Beyond crypto-specific developments, major U.S. economic events also take center stage. These include Q2 GDP results, the Federal Open Market Committee (FOMC) rate decision, the Core PCE Price Index, and Nonfarm Payrolls (NFP). If these data/event reduce expectations of near-term Fed rate cuts, the U.S. Dollar could rebound—putting pressure on crypto prices.
Additionally, Trump’s retreat from pushing aggressive rate cuts or replacing Fed Chair Jerome Powell could further strengthen the dollar, creating more headwinds for the crypto market—unless crypto-focused catalysts deliver strong, positive surprises.


